Simple charts in Ruby using SVG::Graph 2009-02-03
One thing that comes up time and time again when I mess around with a system, is quickly looking at frequencies of various things - for example disk usage by sub-directory, or referrer entries in my Apache access log. Like this:http://librsvg.sourceforge.net/
It tries to be reasonably intelligent about adjusting the height of the graph, but you might want to adjust the width and other parameters. My goal was to get something simple that'll "just work" when I pipe the output of "uniq -c" into it, but any space separated data with a number first and the label afterwards should work as long as the data set is small enough that the graph it produces doesn't become ridiculously large. I'll probably extend it with some command line options, and I want to change the styles used to set colors etc., but the above is enough for 90% of what I want. Note that SVG::Graph also support pie charts, line charts etc.
# cat /var/log/httpd/access_log | cut -d' ' -f11 | grep -v '"-"' | grep -v hokstad.com | sort | uniq -c | sort -rn | head -n 10
 74 "http://www.google.com/reader/view/"
 42 "http://www.rubyflow.com/items/1606"
 35 "http://www.dzone.com/links/creating_graphviz_graphs_from_ruby_arrays.html"
 27 "http://www.dzone.com/links/rss/creating_graphviz_graphs_from_ruby_arrays.html"
 20 "http://www.reddit.com/r/ruby/"
 12 "http://www.reddit.com/r/ruby/comments/7tw1a/creating_graphviz_graphs_from_ruby_arrays/"
 9 "http://www.graphviz.org/Resources.php"
 8 "http://www.netvibes.com/"
 8 "http://www.google.com/reader/view/#overview-page"
 8 "http://www.google.com/notebook/fullpage"
Especially the "sort | uniq -c | sort -rn | head -n something" is a very frequently recurring pattern, in order to get a list of something in descending order of frequency.
But I'm difficult. I want something visual; a chart. Something like this: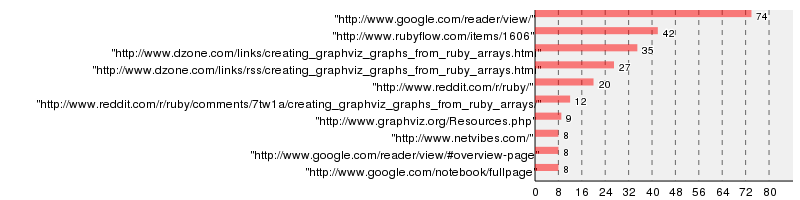
Incidentally, there's a nice Ruby package called SVG::Graph that allows you to generate SVG's from this. The above is a PNG for best compatibility, but here is the SVG version - at least Firefox renders it better than rsvg which I used to generate the PNG.
Assuming you install SVG::Graph from the above page, it's pretty simple to generate the SVG's - just pipe the output from the above command straight into this script:
require 'SVG/Graph/BarHorizontal'

data = []
fields = []
ARGF.each do |line|
 line = line.chomp.split
 data << line[0].to_i
 fields << line[1]
end

graph = SVG::Graph::BarHorizontal.new(:height => 20 * data.size, :width => 800, :fields => fields.reverse)

graph.add_data(:data => data.reverse)
graph.rotate_y_labels = false
graph.scale_integers = true
graph.key = false
print graph.burn
It tries to be reasonably intelligent about adjusting the height of the graph, but you might want to adjust the width and other parameters. My goal was to get something simple that'll "just work" when I pipe the output of "uniq -c" into it, but any space separated data with a number first and the label afterwards should work as long as the data set is small enough that the graph it produces doesn't become ridiculously large. I'll probably extend it with some command line options, and I want to change the styles used to set colors etc., but the above is enough for 90% of what I want. Note that SVG::Graph also support pie charts, line charts etc.